Saddle Search Visualization
This tutorial shows how to visualize dimer and saddle point search
trajectories using plt-saddle. You will produce energy/eigenvalue
profiles, 2D optimization landscapes, convergence panels, and mode
evolution plots.
Reference
The 2D projection method used here is described in:
R. Goswami, “Two-dimensional RMSD projections for reaction path visualization and validation,” MethodsX, p. 103851, Mar. 2026, doi:10.1016/j.mex.2026.103851.
Prerequisites
plt-saddle reads eOn saddle search output: climb (movie file),
climb.dat (iteration log), reactant.con, saddle.con, and
optionally mode.dat.
pip install "rgpycrumbs[all]"
The expected directory layout:
saddle_job/
  climb          # multi-frame .con trajectory
  climb.dat      # TSV: iteration, step_size, convergence, delta_e, eigenvalue
  reactant.con   # initial minimum
  saddle.con     # converged saddle point
  mode.dat       # (optional) final dimer eigenvector (Nx3)
Step 1: Energy and Eigenvalue Profile
The profile plot shows energy and lowest eigenvalue vs iteration. A successful dimer search shows energy rising while the eigenvalue becomes increasingly negative (negative curvature along the dimer axis).
rgpycrumbs eon plt-saddle \
  --job-dir saddle_job/ \
  --plot-type profile \
  -o saddle_profile.pdf
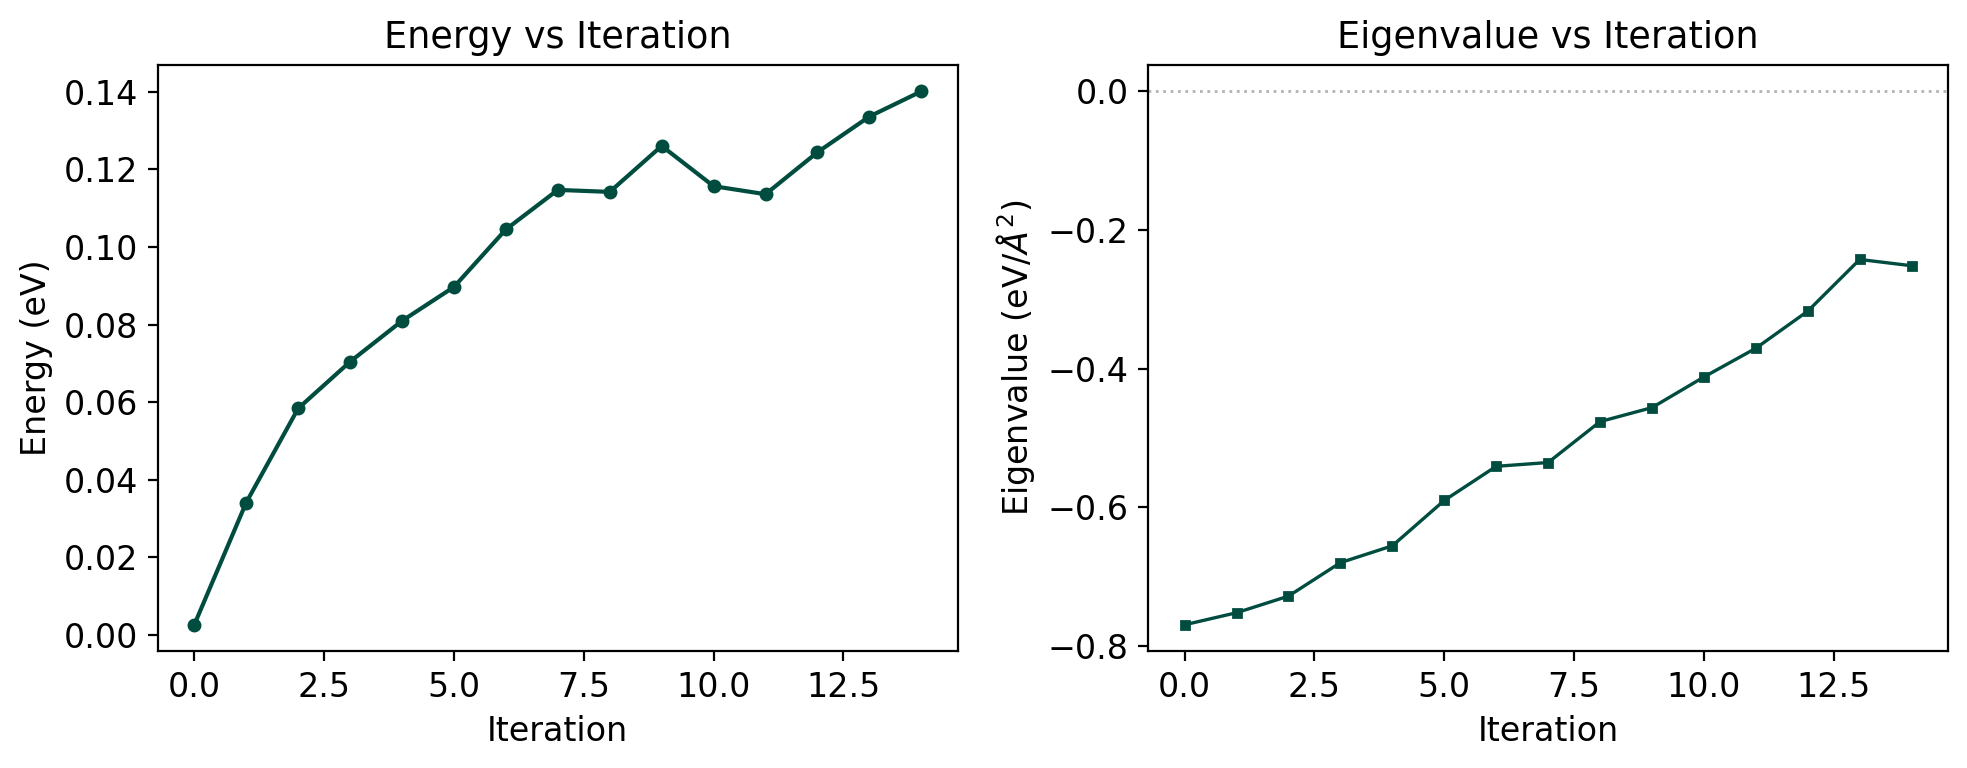
The dual-axis plot shows energy (left, teal) and eigenvalue (right, coral). The eigenvalue crossing zero indicates transition from convex to concave curvature – the dimer has found a saddle region.
Step 2: 2D Optimization Landscape
The landscape projects the trajectory into (s, d) coordinates using RMSD from the reactant and saddle (or an optional product reference):
s (progress): how far along the reactant-to-saddle axis
d (deviation): lateral displacement from that axis
rgpycrumbs eon plt-saddle \
  --job-dir saddle_job/ \
  --plot-type landscape \
  --surface-type grad_matern \
  --project-path \
  -o saddle_landscape.pdf
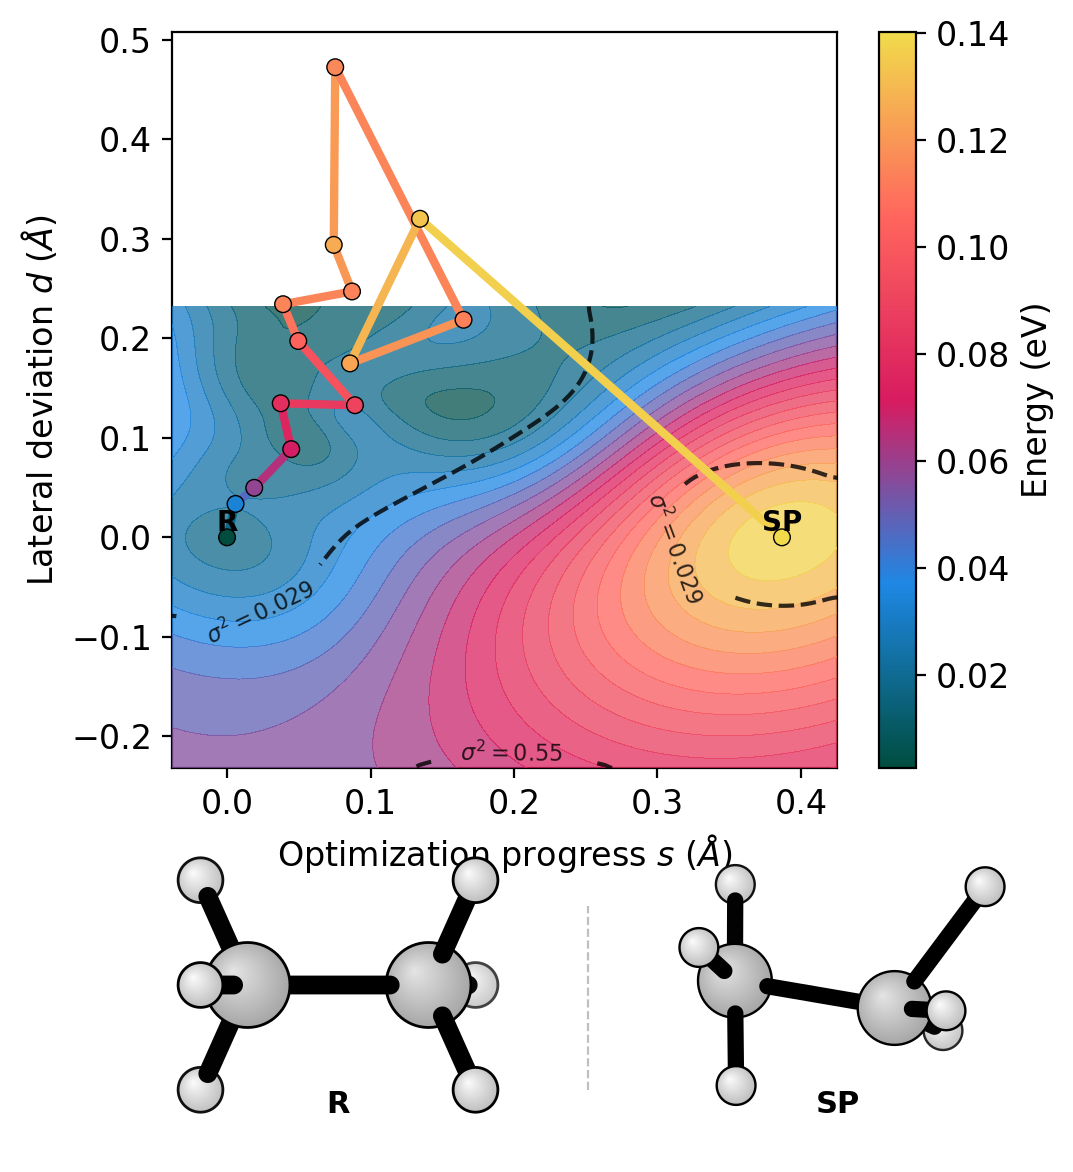
The colored path shows the dimer walking uphill from the reactant basin toward the saddle point. The GP surface contours reveal the energy landscape topology. Dashed lines show variance contours – the surface prediction is reliable inside the inner contour.
Use --ref-product product.con to define the projection basis as
reactant-to-product instead of reactant-to-saddle.
Step 3: Convergence Panel
The convergence panel shows force norm and step size vs iteration – useful for diagnosing convergence issues.
rgpycrumbs eon plt-saddle \
  --job-dir saddle_job/ \
  --plot-type convergence \
  -o saddle_convergence.pdf
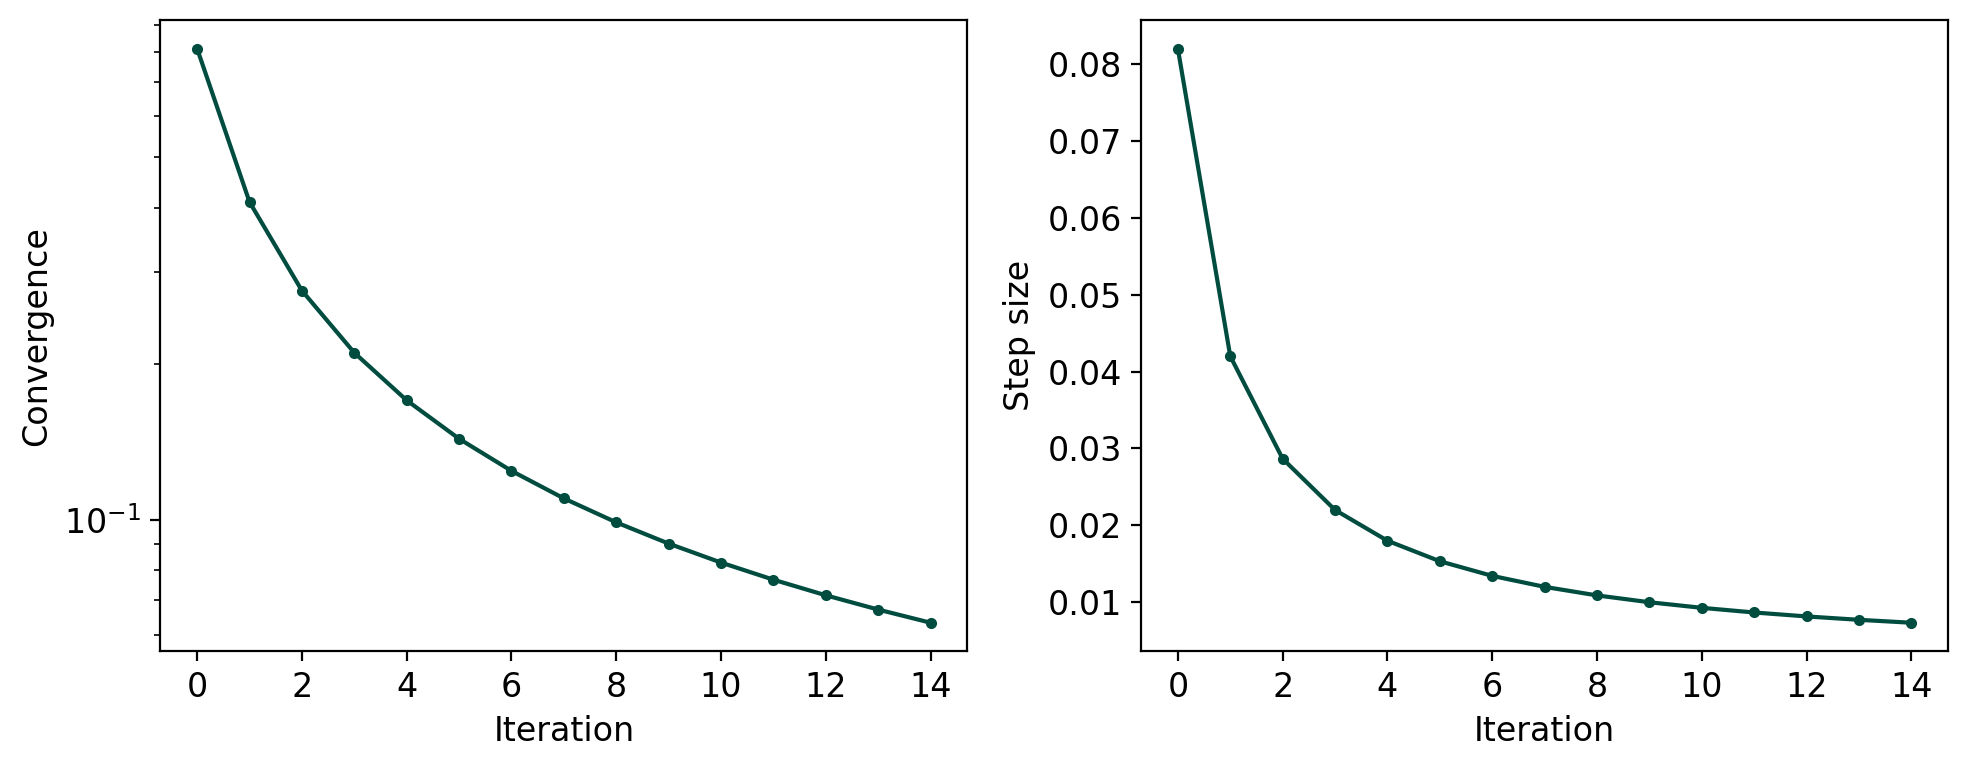
The upper panel shows the maximum force component (convergence criterion); the lower panel shows the step size. Both should decrease monotonically for a well-behaved search.
Step 4: Mode Evolution
When mode.dat is present, the mode evolution plot shows how the
dimer rotation axis aligns with the final converged mode over
iterations. This requires per-iteration mode vectors, which future
eOn versions will provide.
rgpycrumbs eon plt-saddle \
  --job-dir saddle_job/ \
  --plot-type mode-evolution \
  -o saddle_mode.pdf
Step 5: Comparing Optimizers
Use --job-dir multiple times to overlay trajectories from different
optimizers on the same plot. Each trajectory gets a distinct color and
legend entry.
rgpycrumbs eon plt-saddle \
  --job-dir fire_job/ --label FIRE \
  --job-dir lbfgs_job/ --label LBFGS \
  --job-dir sd_job/ --label SD \
  --plot-type profile \
  -o optimizer_comparison.pdf
This works for all plot types – profile, landscape, and convergence. On the landscape, the GP surface is fitted from the primary (first) trajectory, and all paths are overlaid with different colors. The convergence panel shows how quickly each optimizer reaches the force threshold.
# Compare convergence of three optimizers
rgpycrumbs eon plt-saddle \
  --job-dir fire_job/ --label FIRE \
  --job-dir lbfgs_job/ --label LBFGS \
  --plot-type convergence \
  -o convergence_comparison.pdf
Summary
Feature |
Flag |
Notes |
|---|---|---|
Energy + eigenvalue |
|
Dual-axis |
2D landscape |
|
GP surface fit |
Convergence |
|
Force + step size |
Mode evolution |
|
Requires mode.dat |
Product reference |
|
Changes (s,d) basis |
Multi-trajectory |
|
Overlay with legend |
Structure strip |
|
R and SP below plot |
Projection toggle |
|
Default: on |
See Also
Goswami, “Two-dimensional RMSD projections for reaction path visualization and validation,” MethodsX, p. 103851, Mar. 2026, doi:10.1016/j.mex.2026.103851